

Summary
I used an existing work sample for this experiment. To understand the xAPI output, you’ll need a little information about my Captivate content. For each step in this practice activity, learners can:
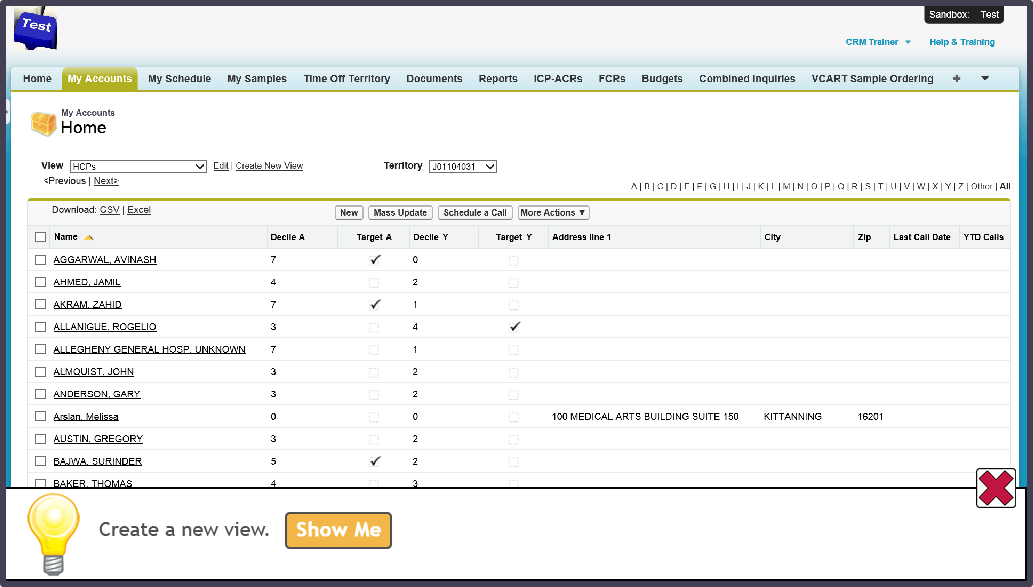
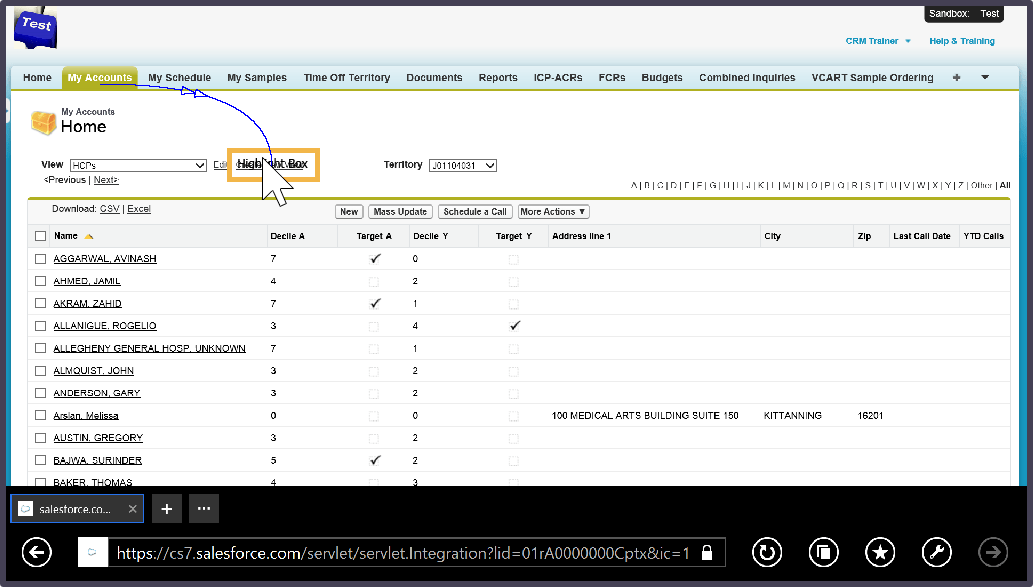
- Click the answer.
- Or, read a hint and then click the answer.
- Or, read a hint and then see a demonstration of where to click.
The first two options are located on one Captivate slide, which uses advanced actions to view the hint information and the Show Me button. The demonstration is on a different slide.
Note: Sean Putman, and others, recommend not using advanced actions when publishing to xAPI from Captivate. But, part of my testing is to see how xAPI will affect the practical aspects of eLearning design. Since I would usually design eLearning with advanced actions whenever it makes sense, I’ll leave them in the course to show what happens with xAPI.
Measurement Goals
There are many things I could choose to analyze with xAPI, but for this course, I’d like to know:
- How many learners click the Hint buttons, and for which steps.
- How many learners click the Show Me buttons, and for which steps.
Imagine having this level of information about the learning we design!
Results
So, how did it work? Fairly well! Captivate 9 produced one xAPI statement per slide viewed. For my test data, I can see that learners chose to watch 11 of the demonstration steps. But, 2 of the demonstration steps were viewed most frequently. With this information, I could dig deeper to understand why learners find those particular steps most difficult.
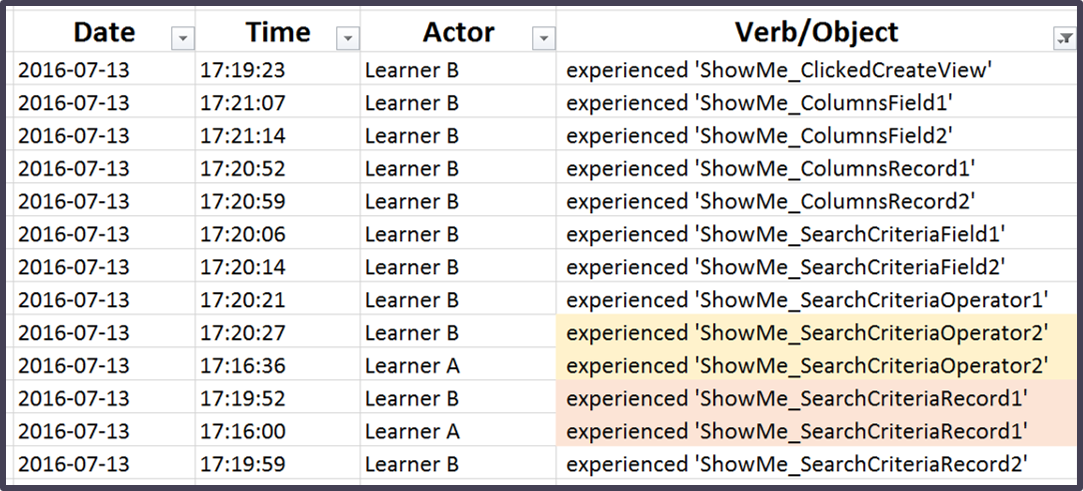
Of course, this is just test data that I moved to an Excel file. If I were to implement this at an organization, I’d use a commercial LRS with lovely graphs and other visual reporting features.
Note: Because I designed the Hint buttons to work with advanced actions, I could not tell when the learners chose to read the hints before clicking the answers. I could only see when they read the hints and then chose to watch the demonstration. In order to gain this information, I’d need to redesign the course so that the hints were on separate slides.
Documenting My Steps
Here begins the very practical part of my #PracticalxAPI project…documenting the specific steps I took, to share with others in the L&D community. You can read down the page, or click one of the links below to jump to the section that interests you:
Jump01
Creating Content
This test taught me two things about the content:
- Slide Titles: Give each slide a unique title. Since the title will display as a part of the xAPI statement, make each title descriptive.
- Advanced Actions: I used existing content that included advanced actions. Had I started with a new Captivate file, I would have put each item I wanted to track on its own slide.
Jump02
Publishing Content
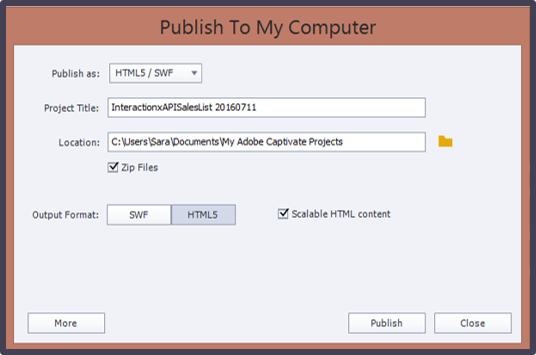
- At the Publish to my Computer window, enter a Project Title, select a folder on your computer where the published files will reside, and select Zip Files.
- For Output Format, select HTML5.
- Click More.
- For eLearning Output, click Disabled.
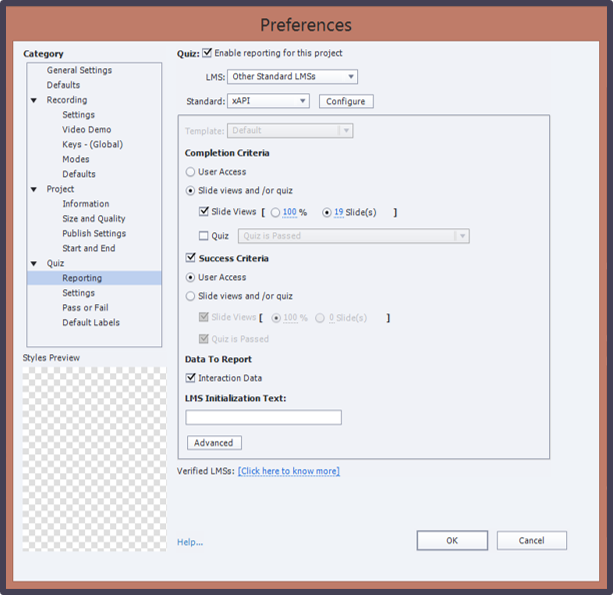
- At the Preferences window, select Enable reporting for this project.
- Click in the Standard field and select xAPI.
- Click Configure.
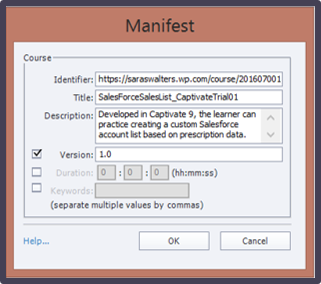
- In the Identifier field, create a unique identifier for this course. Do not use any spaces in the name.Note: Some people recommend to use a URL format for the identifier. But, if you don’t use this format, Captivate 9 will add it for you in the published files.
- In the Title field, enter a title for the course. You can also enter a Description, if you like.
- Click OK.
- At the Preferences window, adjust the preferences for what you’d like to measure:
- I selected 19 slides because, even if the learners didn’t view any of the demonstration steps, they’d still need to view a minimum of 19 slides in order to complete the practice.
- For my Sucess Criteria, I chose User Access, because my course didn’t include a graded quiz. I could have also removed the check from Success Criteria.
- Click OK.
- Click Publish.
Jump03
Uploading to an LRS
There are several companies that can help your organization set up an LRS for your xAPI data. But, #PracticalxAPI is about learning solutions designers testing the capabilities of xAPI. For that, you can use any number of free LRS options.
For this test, I used a free SCORM Cloud account.
Jump04
Creating Test Data
- After logging in to SCORM Cloud, at the top right corner of the Home page, locate the Add Content section.
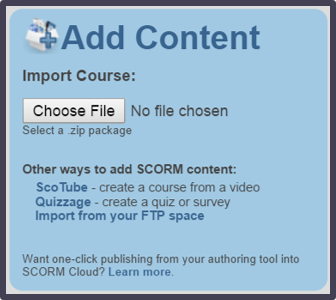
- Click Choose File.
- Locate and select the zipped file that contains your published course. Then, click Open.
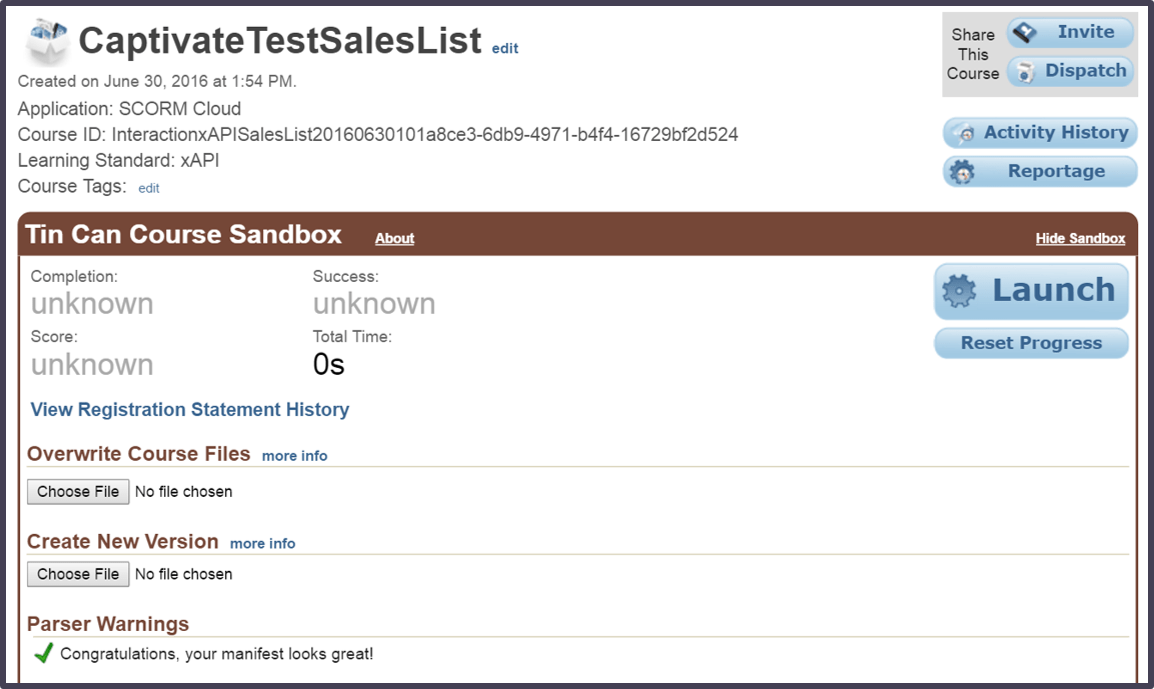
- After the course is uploaded, check the Parser Warnings section to make sure that you see a green check.
- To create some test data, click Launch.
- Run through the course.
- Back in SCORM Cloud, on the left toolbar, click LRS. This is where your xAPI statements are stored. Learn more about the JSON format for xAPI statements.
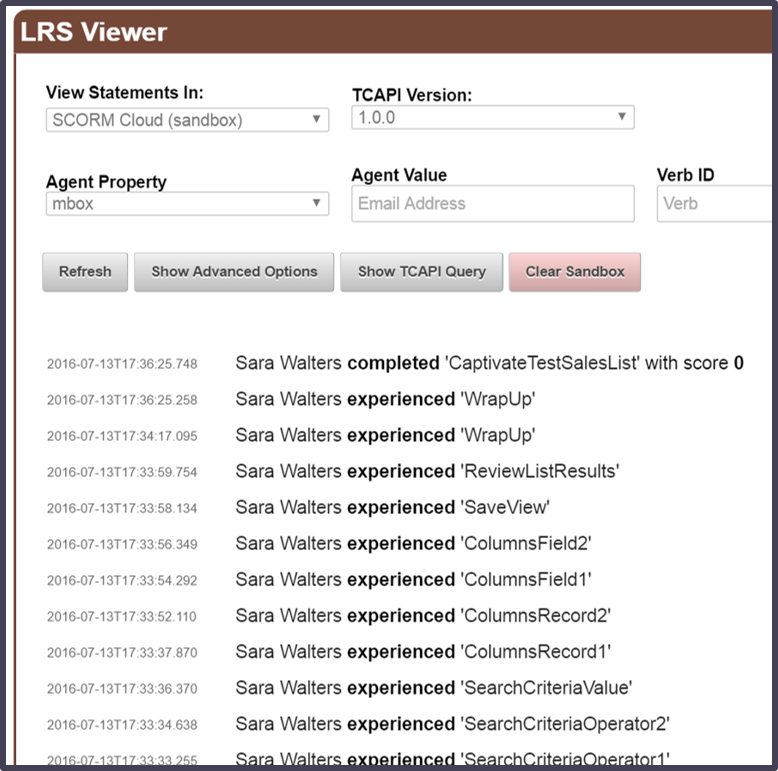
- In the LRS Viewer section, click in the View Statements In field and select the application where your xAPI statements are stored. Don’t know which application has your statements? Then, it’s most likely the SCORM Cloud (sandbox) option.
- The page refreshes as it loads the xAPI statements. So, you’ll need to scroll down to the LRS Viewer section again. At the bottom of this section, you’ll see your test data.
Jump05
Analyzing Test Data
If this were a live course with real learners, then I could use the SCORM Cloud Reportage feature to analyze the data. Since I’m just testing the data, all I can do is view the list of xAPI statements in the LRS Viewer section. Other LRS companies may allow you to use their reporting features with your test data, but since this is my first example, I haven’t tested others yet.
To get the results in the Excel file that I showed above, I went low-tech – that is, I copied the xAPI statements from SCORM Cloud and pasted them into an Excel file. You may not need to do this for your testing. Seeing the xAPI output in the list may be enough for you to understand whether your test worked. I moved my test data to Excel so that I could filter it to show that, even with this first test, xAPI provides a level of data that I’ve never had about my learning solutions.
Special thanks to Andrew Illarionov for the original photo I’m using for my #PracticalxAPI project.
